


- Leigh Peake
- Chief Education Officer
- Real World, Real Science: Using NASA Data to Explore Weather & Climate (Exploring Weather/Climate)
- https://www.gmri.org/our-work/science-education/labventure
- Gulf of Maine Research Institute, Education Development Center (EDC), Stanford University
- Jackie DeLisi
- Senior Research Scientist
- Real World, Real Science: Using NASA Data to Explore Weather & Climate (Exploring Weather/Climate)
- https://www.gmri.org/our-work/science-education/labventure
- Randy Kochevar
- https://www.edc.org/staff/randall-kochevar
- Director, Oceans of Data Institute
- Real World, Real Science: Using NASA Data to Explore Weather & Climate (Exploring Weather/Climate)
- https://www.gmri.org/our-work/science-education/labventure
- Education Development Center (EDC)
Presenters’
Choice
Choice
Public Discussion
Continue the discussion of this presentation on the Multiplex. Go to Multiplex
Leigh Peake
Chief Education Officer
Welcome to Real World, Real Science! This NASA-funded project aims to leverage investigations of ecosystem change as a compelling context for building middle school students’ data knowledge, skills, and dispositions. This school year is our summative evaluation year, interrupted of course by school closures this spring. Our video therefore focuses on two key project aspirations: 1) to enable students to work with authentic data derived from NASA’s Earth sensing systems (for example, global sea surface temperature) alongside locally collected data (for example, state data regarding populations of key species); and 2) to meaningfully connect informal and formal learning experiences and leverage the best of both. We are eager to hear from others about lessons learned creating connected learning ecosystems and about the use of authentic, MESSY data with this age student.
Our team is particularly interested in discussion around questions like:
1. What successful and scalable mechanisms are you aware of for meaningfully connecting students’ experiences inside and outside of school?
2. What approaches (resources, tools, educator support) have you seen that effectively support students to evolve from analysis of small, personally or locally collected data to larger data sets collected by professionals or by remote sensing?
3. What student outcomes related to data and climate have you documented, and what measures have you used?
Looking forward to our conversation!
Raphael Isokpehi
Perrin Chick
I love the connection you make between the skills we teach youth and how it translates to critical thinking adults. I look forward to hearing what people add to this comment thread related to the evolution of working with small local data sets to larger collections of information. I am personally very curious about this.
I love seeing the interactive nature of your data sets and seeing how the youth physically get to touch it and write on it by using the touch screens.
You are doing great work.
Perrin
Thank
Leigh Peake
Leigh Peake
Chief Education Officer
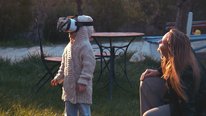
Thanks Perrin! We'd love to think more about how folks combine virtual/technology with "live" or other physical experiences. Ours is one shot at making that work but I'm sure there are others that we can learn from.
Jackie DeLisi
Senior Research Scientist
Thanks, Perrin! Teachers and students have told us that they love the touch tables. They not only enable students to interact with the data, but students can also move around and work in pairs or as a small group.
David Clark
I liked your video and the concept of engaging 5-6th grade Maine students with data about local ecosystems and species that they can relate to. How could they not be interested in this? I would think this could be applied to higher grade levels too. Well done.
Dave
Traci Higgins
Leigh Peake
Chief Education Officer
Thanks so much, Dave. And you're spot on about stretching to other grade levels. We've had high school classes come through and still find the content challenging and we shortened and reworked it for an evening experience for adults. That's the great thing about experiences based on authentic challenges and data -- they're super stretchy in terms of level of challenge. Thanks for watching and commenting!
Traci Higgins
Jennifer Bourgeault
Lin Chambers
Holly Morin
Jackie DeLisi
Senior Research Scientist
Thanks, Dave! The exploration of data about local ecosystems is key for supporting students' understandings of climate. They can relate global changes to local ecosystems and resources.
Gail Scowcroft
Hi Leigh, This is such a great project! It is critical to be educating the next generation of citizens about such important, societally-relevant science and helping them to develop data literacy at the same time. We have found that data related activities in themselves are greatly enhanced when the students can collect their own data, in our case oceanographic data. We usually work with older students, and I commend your project for engaging middle schoolers.
Perrin Chick
Gail what a small world. I would love to reconnect with you. And I agree with you the work GMRI is doing is fabulous for middle school students.
Lynn Farrin
There is so much to love about this project! Keeping it local, keeps it personal and keeps kids invested. And then there's the 'messy data' - looking forward to the discussion that unfolds in this thread.
Leigh Peake
Chief Education Officer
Thanks so much for the kind words, Lynn!
Susan Kowalski
What a great opportunity for students to connect real data with what is happening in the world around them! I'm curious about your strategies for helping students make sense of data. What difficulties did students have in connecting what they see on a graph to real phenomena? How did you help them bridge the divide?
Randy Kochevar
Director, Oceans of Data Institute
Hi Susan! Thank you for your question. In the curriculum, we've tried to help students to connect the data to the real world in two ways: First, we've introduced them to the data in a very gradual way, beginning with representations of tangible, real-world phenomena like temperature, and progressing to more abstract concepts from there. The second thing we've done, both in LabVenture and in the classroom modules, is to create hands-on, "lean forward" experiences, where the students are actively engaging with the data representations - creating new graphs, adding variables to those graphs, adding means or least squares lines, etc.
We are still in the process of learning about what is working and what things students still struggle with; but we are hopeful that this carefully scaffolded approach will help make the data more relatable and accessible. Stay tuned for more as we wrap up our research over the months ahead!
David Clark
Holly Morin
Leigh Peake
Chief Education Officer
I've been mulling your question overnight, Susan, and in addition to Randy's point about building gradually I would add that we lean pretty heavily on carefully selected, compelling narratives of ecosystem change. In the informal experience, a narrative arc (lobster and black sea bass populations are changing in response to warming oceans) is carried through video of our scientists actually doing the relevant research. The result is that students are scaffolded by hearing the story of the data through the scientists' lens while discovering the story of the data themselves. The narrative brings them right up to the edge of knowing "what to look for." So, for example, by the time they hit the maps of NASA SST data, they've heard from many of the scientists how warming oceans were a key factor in the research they're conducting. Students are poised to figure out what "warming" looks like in a fairly complicated data visualization. Such a great question that I'll be pondering for a while 'til I can be more articulate about the answer!
Jennifer Bourgeault
Betsy Stefany
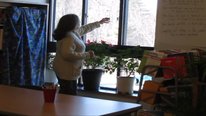
I have been following this conversation with interest as I learn what I've meant to stop in and visit. I collect data right in your neighborhood to carry back up stream then over to NH. We just retrieve a logger from under the ice all winter near Sugar Loaf and will be digging up our loggers buried with tulip bulbs once we finally have the bloom! We deal with messy data and also have projects that tie with data that relates directly to what "warming" looks like to us in New England..and it is not exactly the same response as we'd have expected.
We are in the video conference showing our integration progress of the NASA Aeropod. While that carries us into the low level winds, other extensions compare air, land and water surface in one fun connection of outdoor activity. These projects build from activities moving out from actual classroom phenomenon. Sounds like we should join forces.
Randy Kochevar
Director, Oceans of Data Institute
Hi Betsy! I just watched your video - it looks like you are doing amazing things with your students! One of the things we've been really interested in is how students make that transition from data they collect themselves to larger, more complex, professionally-collected data. I'd love to hear your insights on this subject!
Holly Morin
Leigh Peake
Chief Education Officer
Hey Betsy -- we've had a lot of conversation with some of the Michigan-based AREN team (David Bydlowski, Andy Henry, et al) on the kinds of data their collecting and more generally on students' work (as Randy notes) moving from data they personally collect into the larger satellite data sets. The WeatherX project at EDC (that I don't think is represented here?) is asking similar questions and is in your neighborhood with a focus on the Mt. Washington weather station. We should definitely stay in touch.
Betsy Stefany
Reading along with the discussion on data sets and engaging students has kept me thinking about how our project has met the challenge from a different approach to STEM integration.
Our approach to data is that it is one part of the STEM Literacy and not the full aspect of how a STEM project is understood and communicated. The data becomes “situated” by visuals, yet applicable by focusing on the form of the measurement activity rather than the number. For example, figuring out what lumens/ft2 is and what we may miss with the pace of timing of the sensor etc.
Our tie with the LEED and building measurements expands from the AREN team, transferring the tool kit earlier to different applications by student choice (taped to the baseball backstop during last year's March of 4 Nor'Easters, for example!)
Thinking through the process of how a measurement is built on change and influencing environments creates the focus to be on how the design of the Aeropod functions to support the use of the instruments it carries as well as the output record. We are additions to each other and the sensors rely on our placement and use. That's an empowering part of the team building that goes on in the video that was fun for me to capture and share. The visualization of data to ensure that the local projects continue to have agency and sustain their ideas with further applications is a bit different from building data sets over time, however very engaging and easier to apply to small observations that build evidence for the student of changing climate.
Ed Robeck
Director
This is some pretty sophisticated stuff going on with the kids--a great statement about what young students can do when given inspiring resources. I wonder how this goes when you get back in the classrooms. It sounds like you've got some committed pilot teachers. How did you engage with them? Are they connecting what is going on to the standard curriculum (i.e. what other classrooms are also covering), or is this a particularly enriched curriculum that is in addition to what they would normally cover?
Leigh Peake
Chief Education Officer
Thanks for having a look, Ed, and for the questions. I'm going to answer some of them and then ping my co-presenter Jacqueline DeLisi to weigh in others. We have a great group of teachers overall in the program, many of whom have been participating for ~15 years and were eager for us to add more substantial classroom curriculum. Through this project we were surprised and pleased to find that science teachers in particular were eager for support to focus on data literacy within the scientific enterprise. Science is so minimally treated in so many schools that the strong data focus gave some teachers the "excuse" to partner with the math teacher to give more time for the investigations. A key support/engagement was a multi-day professional development institute. Teachers go through the informal experience themselves, pausing throughout to reflect on the data and climate concepts students will experience. Those same data and climate concepts are picked up in the curriculum but nestled into stories about local ecosystems. During the PD teachers choose which module they'll do and in small teams walk through every page, co-learning and in many ways co-developing as they make adjustments. Maybe most important they spend at least half a day working with the data itself and going through the student activities related to the data. This is a chance to uncover places of confusion for them that we collectively tackle and clarify. Maybe most important, we try to together land on solid, effective language to use in classroom discussions about data -- this is a promising place for future work, IMHO. Jackie has the data around the relationship to their curriculum, but I'll just say that 1) Maine is a local control state so the teachers have a lot of flexibility; and 2) both the informal and formal experience focus on a tight set of NGSS and CCSS-M standards to help teachers figure out where it "fits." Hope that helps -- and thanks for the questions!
Lin Chambers
Jackie DeLisi
Senior Research Scientist
Hi Ed! Great question and observation. Thanks for asking! About aligning to standards, we're finding that teachers across disciplines find connections to the curriculum-- as Leigh notes., there are connections to CCSS-M standards and to NGSS, and we've had some teachers tell us they see clear connectiosn to their social studies units. Science teachers have told us that they are excited about the curriculum because it gives them a new way to teach about climate, and most teachers like the clear use of data as evidence to support claims. Some teachers have also told us that they have added this to their prior ecology units.
Margaret Baguio
Seeing the students and teachers doing the activities in Real World, Real Science is truly motivating. The activities look amazing. We must figure out a way to include the activities with SEES. Great job!
Leigh Peake
Chief Education Officer
The pandemic forced us to experiment with creating an entirely virtual version of the informal experience as well as adjusting curriculum to be carried out through online education. Both of these might make it more possible than previously to integrate with SEES. Lets talk!
Scott Byrd
Leigh and team, amazing project--love the data/analysis "tinkering" that youth get to engage in with peers and experts! I am interested in how much you make the MESSY data a programmatic element. If I think of our own work we spend a lot of time collecting, cleaning, merging data (maybe that's 80% of what we do!) then the actual analysis/synthesis phase takes much less time... to me that is authentic science. I guess that might be one strategy to link the informal and the formal or the personal to the professionally gathered data--to lean into the data cleaning and merging strategies; though not the most exciting process--might have to give it some drama for 5th and 6th graders?
Jackie DeLisi
Senior Research Scientist
Hi Scott. Excellent question-- thanks for asking. In order to create compelling data narratives we had to balance many factors including the availability of data and students prior exposure to data visualizations and skills. We also had the constraints of time-- the field trip is 2.5 hours, and teachers varied in the amount of classroom time they could dedicate to the curriculum, even when it aligned to their standards. We also wanted to give students an authentic scientific experience, which certainly includes thinking about what to do with messy data. However, since this is among the first experience that most of the students have with making sense of large data sets, we wanted to be able to support them in using the data to create a compelling narrative, which meant supporting them in manipulating and interpreting the data in order to support claims. As Leigh notes, we do introduce them to the uncertainty and messiness in data in various ways and there is an activity where students are asked to sort data about black sea bass to help address a question about whether black sea bass are a predator of lobster. I'd love to hear more about how others address this question and find a balance between keeping the experience authentic and open-ended, supporting students to think deeply about the data, all within a compelling narrative.
Leigh Peake
Chief Education Officer
Hey Scott and thanks for the comments/questions! You're right -- somebody somewhere is going work with messy data to make it feasible for kids to work with it and derive meaning. We spent HOURS talking about this and viewed it somewhat through an ethical lens with a concern that if we clean things up entirely we take away the reality that the stories kids are working on are not yet "done" so there is openness for patterns to emerge other than the ones we might highlight in the cleaning and processing. We deal with it very directly when kids are working with small (very small) data sets. "Why did your group come up with a different measurement than mine and what do we do about it?" When they're working with professionally collected data that is still sized to be manageable within, say, a single data table, we start talking about patterns and outliers. For the large data sets (e.g., sea surface temperature) we chose to use the data points that most dramatically show the overall trend (e.g., September average SST over time). I think the point you're making about figuring out ways to expose kids to the sorting, filtering, cleaning "moves" that are part of working with big data. I've been thinking a lot about whether the sorting, filtering, cleaning we can reasonably get young kids to do with smaller data sets is even the same kind of thing as what they'll do later -- is it actually a continuous growth line from the early application of those moves to more sophisticated ones? Or is there some other kind of work that has to happen to jump to the more sophisticated work? I know there are other projects thinking about that also so hope they weigh in here!
Scott Byrd
Love the idea/concept of data "moves" (may borrow that phrase ; )--all of those decisions made about what datasets, data regions or chunks to include or not--ideally guided by research questions (grand, sub, or otherwise). Those moves make me think of set-theoretic research methods... sorting through what is necessary and/or sufficient--what goes into each data bucket, how do those buckets relate to others and for what functions. Will look for other projects, references in that vein!
Jan Mokros
Hi Scott,
We've been thinking a lot about how much students do to organize and clean data on the Data Clubs project too. The idea of "data moves" comes initially from Tim Erickson, who has a good paper on it. He also has a second paper on it with colleagues Michelle Wilkerson and a few others. It's interesting reading!
Leigh Peake
Chief Education Officer
Jan beat me to the attribution of "data moves" to Tim Erickson! We stand on the shoulders of giants.
Lin Chambers
Can someone post the reference(s)? Would be interested to have a look.
Leigh Peake
Chief Education Officer
Erickson, T., Wilkerson, M., Finzer, W., & Reichsman, F. (2019). Data Moves. Technology Innovations in Statistics Education, 12(1). Retrieved from https://escholarship.org/uc/item/0mg8m7g6
Leigh Peake
Chief Education Officer
But for a much quicker synopsis: file:///Users/lpeake/Downloads/304473.pdf
Lin Chambers
That link doesn't work - it appears to be to your local system?
David Campbelll
Program Director (retired)
This project includes two important topics, understanding the effects of climate change and interpreting data. You mentioned the PD for teachers, but I’m curious how much preparation the students have before they visit GMRI, and if they spend more than a day there. It’s great to see there’s an extensive follow-up in the classroom
Jackie DeLisi
Senior Research Scientist
Hi David. Excellent question. Our goal is to more seamlessly integrate the GMRI experience with the classroom. However, most students that visit GMRI have little preparation beforehand. Among the teachers who do any preparation, some give students a short preview by, for example, telling them that they will get to hold a lobster or that they will work in groups with a touch table. Most of the preparation is in getting students excited for the field trip. Also, this winter two teachers who are part of our evaluation introduced students to some data skills prior to visiting GMRI, which they claimed worked well for supporting students use of the data during the field trip and while using the curriculum modules.
Jeffrey Ram
Leigh Peake
Chief Education Officer
As Jackie says, great question. We've offered "pre" materials in the past and only seen about 10% of teachers use them. Maybe that's average or maybe the prep materials weren't the right ones. I'm interested in input on this. Teachers want material that would help their kids "do better" while at GMRI in the experience, which worries me. We don't want there to be performance expectations while they're with us. That said, some teachers engage kids with a few key data concepts before they come, others use some resources we've provided around vocabulary. We've wondered about a pre-focus on the connection to GMRI science: "You're going to be doing the same work as GMRI scientists do, so let's understand more about GMRI and their work." Any of these are ripe for more support, so curious if anyone out there has experience about what sort of activity might help kids enter fully engaged, which I think would be our only goal. Thoughts?
Holly Morin
Jeffrey Ram
Very neat visualization equipment (I can only dream of our Aquarium having comparable video "tables") and intriguing video. We have similar problems with teacher previews and follow-up activities--but a somewhat better success rate (until COVID-19) because our project educators and researchers actively seek out pre- and post-field trip visits to the teachers' classes. Main difficulty with follow-up: the school continually changing teachers' assignments and schools [in effect, cutting them out of our project] and churning the curriculum. It sounded like you are promoting your program at numerous informal education places. Please bring your program to Detroit! We would also like to see what you've developed "virtually" for this grade level.
Leigh Peake
Chief Education Officer
I'll be in touch, Jeffrey. We whipped up something this spring but we need to do better if "virtual" is going to be part of our forever story, so I know we can learn from an exchange with your team.
Jeffrey Ram
We've just found out that we are going to have to do our Summer Institute professional development this summer by a virtual method. We will be brainstorming the tools and techniques we will use next week. Many ideas at this video showcase may come in handy. Ideas for virtual interaction and learning about food webs, adaptations, observation, etc. will be discussed. Perhaps will ship "do it at home" supplies to participants, because we can't sacrifice "hands on" to "no hand shakes". Suggestions welcome.
Jeffrey Ram
We've just found out that we are going to have to do our Summer Institute professional development this summer by a virtual method. We will be brainstorming the tools and techniques we will use next week. Many ideas at this video showcase may come in handy. Ideas for virtual interaction and learning about food webs, adaptations, observation, etc. will be discussed. Perhaps will ship "do it at home" supplies to participants, because we can't sacrifice "hands on" to "no hand shakes". Suggestions welcome. (P.S. If this appears twice, it's because there something malfunctioning. I put it in, left the page, came back and it was gone. So I am repeating it [maybe?]
Brian Kruse
What a great project! It is good to see the integration of in-classroom, and informal venue experiences as learners develop a more complete model of natural phenomena. Ensuring the field trip is more than a novel experience outside the overall curricular experience is essential. Something we strove to do in our own project. Thank you for sharing!
Jackie DeLisi
Senior Research Scientist
Thanks for your comment, Brian. Glad you enjoyed the video and saw the connection to your own work. We agree! Connecting the out-of-school experience to the classroom is a major goal of this project. We're beginning to see some indication that doing so helps to reinforce students' learning across both contexts.
Leigh Peake
Chief Education Officer
Thanks Brian! I loved your video and commented likewise on the similarities. Great work!
Steven Greenstein
Associate Professor
I don't mind echoing the praise that others have given you for this project. It's really wonderful. I especially like the emphasis on the personal effects of climate change -- how one's community is being and might be impacted. What have you learned from students? What beliefs and ideas do they bring to their lab work? What general advice do you have about how to leverage students' community knowledge in learning situations?
Holly Morin
Leigh Peake
Chief Education Officer
What a great question! I'm going to dodge it a little bit because we haven't looked at that in our research. That said, as project designers we are mindful that a large percentage of the kids in the room will come from families that depend on the ocean for their livelihoods. And the science they engage with in our program demonstrates that those livelihoods are changing. Kids readily bring that experience forward during the informal learning experience -- they are super proud after seeing the video of our lobsterman-scientist to share that their family is a lobstering family! But we spend a lot of time worrying about sending a 10-12 year old home to a dinner table not particularly receptive to the message about warming oceans and species change. Our answer (so far) has been to focus on kids deriving their own understandings from the data. Throughout the experience they record video reflections of their learning. That all travels home in a digital Field Notebook that analytics suggest they open with families. We try to keep those reflections focused on claim-evidence kinds of statements and framed in terms of the data they've seen. Nevertheless, our informal educators have to be ready to take all the statements they're given drawn from students' community knowledge and incorporate them into the experience -- the science around changes in the Gulf of Maine isn't complete so their observations might be important data points!
Steven Greenstein
Holly Morin
Jackie DeLisi
Senior Research Scientist
Steven, this is a great question. I'll just add to Leigh's response by saying that based on observations and interviews with teachers we know that students have some prior experiences with the topics of the modules-- lobsters, ticks, ice out-- and their experiences help them connect to the classroom activities. When they begin the classroom modules, teachers spend some time eliciting some stories from students, and they are eager to share stories such as the ticks they have found. We have seen some similar interactions during the Lab Venture visit, for example when students share stories about lobsters they have seen or going out on a relative's lobster boat. It is also clear that some students are exposed to news stories about changing ecosystems. Although we haven't explored this in our research, we would hope that what students are learning from this experience also helps them make sense of what they might be learning elsewhere in their communities.
Emily Weiss
I'd also like to echo praise for this project. I don't think I have anything to add that someone hasn't already said about the great work you're doing.
I'm wondering if you've heard of students turning their learning about locally relevant data into service learning projects.
Also, you may already be aware of this, but we worked on a really interesting collaboration with Rutgers and Padilla Bay National Estuarine Research Reserve to help teachers engage students with locally relevant data and improve their data skills. You can find some of our resources here: https://mare.lawrencehallofscience.org/curriculum/climate-data-aclipse-activities
Thanks for sharing this very exciting project!
Leigh Peake
Chief Education Officer
Will check out that resource immediately, Emily. Thank you! We don't see a lot of service projects out of this work, but we do see it in our citizen science program where students develop and share plans for the mitigation of invasive species. Interesting to think whether that's the next place for us to go with the program in the video!
Holly Morin
It is projects like these that honestly reinvigorate my passion for informal education and getting students interested and hooked on science. I am especially excited as I know and appreciate GMRI and Lab Venture's efforts, and can only imagine an expanded, revamped program!
I have throughly enjoyed reading the discussion above, as I had similar comments and questions, and your responses have been informative and interesting- many thanks for that! The PD you are offering where you are letting teachers choose which module they'll do and in small teams walking through the content, co-learning and in many ways co-developing as they make adjustments is really key (and fantastic!!). Many teachers, especially elementary school teachers, are data shy or even science shy (even though it is being integrated into elementary school standards now), so getting them familiar with the data and analysis processes will only make it easier for them to transfer knowledge to their students in the classroom and efficiently work though things. One question though with regards to standards, have you felt any push back from teachers about how things can't fit? I know that you mention above teachers work to make things that they choose "fit" into their curriculum (having insight, of course, as to which will work best in their classroom setting), but have you found some modules "plug and play" easier than others, and what about those modules makes them easier for curriculum integration- is it they focus on a topic that aligns really well with a NGSS standard, or that they cut across math, social studies, etc., or perhaps both?
Have you also thought out student ambassadors as an extension of the project? Or perhaps a culminating poster session of sorts (which could now be done virtually), where students from different classes/groups are able to display and discuss the data they have worked with and receive feedback from other groups. This would be another set of skills that could transfer to life skills and a student's general career pathway. Just curious how you round things out for the students as they complete your program.
Thanks again for all your hard work- it really is fantastic work you all are doing!
Jackie DeLisi
Senior Research Scientist
This is an excellent idea, Holly. I love the idea of student ambassadors or having a culminating poster session. I've had this idea for a while that it would be great to see if any of these schools have science fairs and think about how they might extend some of their classroom data explorations to a science fair or similar venue. It would also be interesting for students to be able to see what other students are learning about based on other data sets.
Holly Morin
Holly Morin
I think the idea of a science fair (and even hosting something such like that virtually) is a really fascinating idea- beyond a poster session, but still honing in on communication skills that are so important to build. I look forward to following along with this project!
Leigh Peake
Chief Education Officer
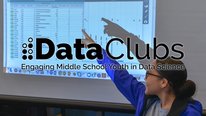
First, thanks for all the great ideas and questions, Holly. You guys are definitely onto something. In another project (Data Clubs -- also in the Showcase) we had after-school youth who had been studying ticks & lyme present their research to staff at GMRI, including our super scary (not) Chief Scientist. I think we have all seen that the need to encapsulate learning into a presentation of some sort drives a different kind of attention to detail and learning. We also saw those kids think on their feet when asked questions like "What would you want to look at next?" (Data about deer populations was the answer, by the way.) We've also begun a middle-school journal of science writing called Findings from the Field where students report on investigations. It, too, shows the tremendous motivational impact of sharing your work. The key to both of those, though, is the power of having to communicate to an outside, non-school, authentic audience.
Lin Chambers
The GLOBE Student Research Symposium (highlighted in another video in this showcase: https://stemforall2020.videohall.com/presentati...) might be a good model to consider to develop this sort of culminating experience.
Randy Kochevar
Director, Oceans of Data Institute
Hi Holly! Thank you so much for your question, and for your interest in this work!
Regarding standards, as we started developing the program and the curriculum modules, we surveyed a variety of different resources for information about relevant data skills to be teaching at this age, including NGSS, CAT, CCSS, etc., and from these, we came up with a condensed set of priority data skills that we wanted to teach through the experience and the curriculum:
Collecting and Decoding Data
Analyzing, Interpreting, and Communicating with Data
Critical Thinking with Data
We also recognized that not all topics will "fit" in all classrooms, so we've tried to come up with a range of topics in hopes that at least one might find a comfortable place to land. We have a couple of modules that focus on marine ecosystems, but we also cover ticks and Lyme disease, ice-out dates on Maine's lakes, and are working on new modules around lynx, blueberries, loons, and potatoes.
Our hope is that by creating materials around a variety of locally-relevant topics, and aligning the data skills with a variety of state and national standards, we make it easy for teachers to find ways to fit them comfortably into their lesson plans.
Regarding student ambassadors - I love that idea! I think that the idea of students sharing their work with others is a great "next step" in building these kinds of skills, and I'd love to learn more about successful models that others have used to do this!
Raphael Isokpehi
Holly Morin
Holly Morin
Many thanks for your thorough reply, Randy. I really appreciate how your group surveyed the standards landscape and then determined a "condensed set of priority data skills" that you wanted to teach through your programming (as opposed to solely fitting content into the standards). I really appreciate this approach and then the details you provide above.
During each year of our Marine Technology for Teachers and Students (MaTTS) project, we had cohorts of students and teachers from different high schools across southern New England. At the end of each year, we presented the students with an ocean exploration challenge, for which they had to cruise plan, and then innovate a technology or process that would help them achieve their stated goals. Students presented their work in a combined lightening presentation/poster session event, which proved to be a really successful event for all involved.
Thank you again for the thoughtful reply!
Sarah Krejci
I really enjoyed your video and project! As an oceanographer, the topic is very close to my heart lol!
I see the detailed standards you are addressing through the project, by I'm curious what assessment tools are you using to measure how the lessons are meeting those standards. Are the students attending these sessions as field trips where you can do pre/post testing, or are you using any software to track their movements on the smart boards?
Have you considered analyzing their ability to interpret the visualizations at different levels of understanding, such as: elementary level of identifying data points, intermediate level of identifying trends in the data, and advanced level of identifying patterns not implicit?
Jackie DeLisi
Senior Research Scientist
Hi Sarah, thanks for asking this great question. Our evaluation team has been developing an assessment that will allow us to examine students understandings of data and some visualizations. It's a paper and pencil assessment with both open and closed ended questions. I was hoping to use some of students' work in their field notebooks and in their classroom work to also assess their thinking, but the amount of data and variability from these sources has so far been inconsistent. We are also partnering with Stanford University to understand students' thinking through two different online "choice-based assessments", which put students in a game environment where they have to make choices about using different visualizations to tell a story. We're in the middle of analyzing all of these data now and hope to have more to share, both about the measures themselves and students' thinking, in the next 3-6 months.
Holly Morin
Sarah Krejci
Thanks for the reply! I can imagine the informal nature of the interactions are a challenge to track for assessment! I'd be very curious to learn more once you are ready to share.
Catherine Stimac
Wonderful project! I especially appreciate the place-based aspect and the intention and understanding on the part of your team that these same kinds of interpretive skills may follow students throughout their lives as they "interpret complex news stories" and make future decisions.
Leigh Peake
Chief Education Officer
Thank you, Catherine! We love M'Kenna!
Catherine Stimac
Todd Campbell
I appreciate your work with around sensemaking with data, especially connected to climate science/change. Have you been able to or thought to publish any of your curriculum approaches in the NSTA journals? I am only asking, since I think there still exists a shortage of resources to support teachers in this area. Thanks for sharing your work!
Leigh Peake
Chief Education Officer
We haven't, Todd, and we need to. Thank you for the nudge!
Todd Campbell
Michael Rosenfeld
What a great project. It had me wondering about broader applications. How challenging would it be for educators in other states to adapt this approach to what's happening in their own students' back yards?
Randy Kochevar
Director, Oceans of Data Institute
Thank you for your question, Michael! I really love the idea of creating learning experiences with authentic data that are regional, and thus more relevant to students' lives. And I think that it is quite possible for educators to create these kinds of experiences for their students.
With that said, it can take a surprising amount of time and effort to identify those datasets that lend themselves to student inquiry, and to create an engaging and accessible sequence of analytical steps through them. The challenge is finding that perfect balance where one question leads to the next, and the whole journey takes the students somewhere that yields new insights or understandings – without feeling too contrived or tedious. There is definitely an art to it – and I feel like we are still just learning how to do it!
Leigh Peake
Chief Education Officer
I'm really glad you asked, Michael. This was an aspect of the project that hit the cutting room floor. Simultaneous to our work in Maine we've been fortunate to work with a network of small science & technology centers across the northeast who have been working through their own approaches to the fundamental premises of the project -- connecting informal & formal learning and using climate science as a focus for supporting explorations of data. Their work has been SO creative. For example, the Montshire Museum in Norwich VT spearheaded development of a ticks & Lyme exploration that starts in a much more hands-on way, looking at ticks under the microscope and identifying species of ticks. They even made a public engagement exercise out of collecting the tick samples (and got enough to send collections around to all the other museums in the network!). This leads into looking at their local state data on Lyme disease and they were able to offer their teachers the Ticks & Lyme curriculum developed for the project in Maine. We haven't tracked uptake of the curriculum in other places, but will be doing that going forward. My cautionary tale: at the heart of each narrative is a local phenomenon (e.g., patterns in blueberry production), for which we have solid local data (from a UMaine Extension agricultural scientist), that has a strong climate signal ("cooling" days), for which we also have data (temperature data over the winter months). Those stories have turned out to be remarkably difficult to find, so not for the faint of heart.
Julia Plummer
I really liked hearing about how students can gather data and ideas in their Digital Field Notebook and then bring that back to the classroom with them. That is a great strategy to help teachers support students in continuing to work with the ideas and make meaning that will be durable over time.
Leigh Peake
Chief Education Officer
Thanks Julia -- it's been a special part of the program for sure and a good way for families to share a bit in the experience also.
David Sittenfeld
This project is terrific. I also am a big fan of the digital field notebook idea. Are there things you have learned about what practices tend to encourage this kind of sustained participation after the in-person interaction? Seems like an important thing for us all to learn from as we chapterize and connect different kinds of experiences together in our new normal. Thanks for sharing this video and for the great work!
Leigh Peake
Chief Education Officer
Coming from you, David, that's a real compliment! We haven't done nearly enough around the Field Notebook -- it's ripe for further development. Randy's team at EDC developed a "Recap" lesson for the classroom that focuses on revisiting what was done/learned during the informal experience. I'd like to keep iterating that because I do think it's an opportunity to concretize key messages from the field trip. But there's much more yet to come to meet your challenge of "sustained participation"!
Margo Murphy
Great work!!
Leigh Peake
Chief Education Officer
Thank you, Margo! I hope all is well and you're sheltering safely.
Eden Badertscher
Leigh, this is such great work. I am so glad it is progressing so well. Since there is a real place-based element to it, has there been much focus on either of the following:
The answers to these questions could be so valuable in our project as we think about STEM ed for those who are incarcerated.
Wonderful work. Hopefully. I can come up again sometime when we are not sheltering in place to see you and GMRI.
Eden
Leigh Peake
Chief Education Officer
Thanks for the questions, Eden! We've been working with a fantastic network of 12 science & technology centers across the Northeast in this project. Each has interpreted the goals and work in their own way, but in the next stage of the work we hope to focus more deliberately on what constitutes "the model" and how we can support it to be versioned organically elsewhere.
For purposes of serving students & teachers during the panedemic, we created a "virtual" version of the field trip where we have taken over teachers' classrooms for five days (1 hr/day) to engage kids with the heart of the content. It's been extremely well received, including involvement by schools who haven't ever come over our 15 years of delivering the program. That leaves us with quite a challenge: should we offer it virtually AND in-person going forward? The trip is entirely free (we pay for transportation) and for many kids in Maine it's they're first time outside their home county, first time to the ocean, etc. and for nearly all it's their first time to a scientific research institution. We've always felt that had such incremental value that we didn't want to risk reducing in-person visits by offering virtual. But this time has given us pause. It's time to rethink.
Already looking forward to whenever you get to visit!
Michael I. Swart
Very neat tool. S'great that students can connect their museum experience to the classroom. Curious about the museum experiences. Are the museum collaborations of kids using Real World Real Science? In our work, we also provide a technology for learners to collaborate and would love to see, hear, know more about how this tools creates and curates curiosity!
Leigh Peake
Chief Education Officer
Thanks for the opportunity to clarify! Kids/visitors in our museum collaborator institutions are experiencing climate/data investigations of our partners' own devising. Now with a virtual version of our experience created for the pandemic, we're pondering ...
Marcy Seavey
Wow! Leigh, what a great project. Since I am in landlocked Iowa, what do you think will need to happen in order to be able to take this project to scale across the US using different datasets and issues for different regions? Is that a possibility? Or what resources are available for new partnerships to take the technology and apply it locally? How much of the project is open source?
You asked:
1. What successful and scalable mechanisms are you aware of for meaningfully connecting students’ experiences inside and outside of school?
The GLOBE Program (www.globe.gov). I see on one of their videos that you are a new GLOBE partnership - Welcome to GLOBE! The variety of protocols available and the amount of data accessible makes it possible for students all around the world to ask and answer their own questions. GLOBE community and online resources provide necessary support.
I think there are many other citizen science projects which, like GLOBE, give students access to the process and content of science in meaningful and feasible ways.
2. What approaches (resources, tools, educator support) have you seen that effectively support students to evolve from analysis of small, personally or locally collected data to larger data sets collected by professionals or by remote sensing?
I think there is a big need for this.
On my campus, our Meterology Professor has had success engaging students and teachers in big NWS datasets thought learning to make weather predictions. He built the STORM Project Website with a tool that verifies several different individual weather prediction strategies (persistence, climatology) and several models daily for several locations in our state. Each student or pair of students can use the tool to enter their own daily prediction for high and low temperature and precipitation. The tool will validate and score all of the predictions and rank the students and the various models and methods. Students learn how to access NSF datasets in order to develop their own predictions. In just a 3-4 week class almost everyone becomes better at making predictions that climatology - which is the definition of a skilled forecast. I love this project not only because it introduces students to big data but also because it introduces them formally to predictive science. They are motivated by the idea that even the teacher doesn't know the "right answer" or what will happen (which is often not the case in other field research). Some classes plot the local weather report to see if they can do better. They also learn that weather prediction still requires humans, each model works best at certain times and conditions for each locations - learning local patterns can increase your success!
One of the earliest examples of this strategy that I have experienced was several years ago (probably 15? or so). I took a tour of an Indiana DNR education program that connected students to state data sets through inquiry based field activities and an interactive website. Teachers and students would do some pre-work, then go on a field trip where they would collect some of their own data (the activity I did involved each of us observing and collecting data at a local wetland and determining if the wetland would be a likely habitat for a specific bird), then using the DNR trailer's wi-fi, they would enter their data into the website. All of the student data was combined with state data. The students would learn which of their birds had been seen on the wetland that year and where in the state the other birds had been found. Back at the school, the teacher would lead the students through additional activities that involved using the website to map all of the data and making a list of birds that the class would expect to find or not find in that wetland throughout the year. Then adding DNR bird count data to verify and look for trends in which populations were coming to the wetland. Finally, they could overlay surrounding land uses and try to make sense of changes in bird counts over time based on their observations and historic data.
Leigh Peake
Chief Education Officer
Thanks so much for all of this, Marcy. We're absolutely on the same page about citizen science. In addition to GLOBE, we've been running a citizen science program for classrooms for about a decade and absolutely see how citizen science -- even done inside the classroom -- has an "outside of school" feel that's important to retain and emphasize. It doesn't feel like students' experience of "doing school." And thanks so much for the STORM and DNR examples. Much to learn there. I'll think about how we move into Iowa!
David Uttal
Great work and very happy I got to see it not only here but also "live", in the pre-pandemic age, long long ago.
Leigh Peake
Chief Education Officer
Already looking forward to your next visit!
Traci Higgins
What a great project! Wish there was something like this going on when I was growing up in the western foothills of Maine! I love that you are expanding the work to high schools and adults as well. I'm curious about future directions you are imagining for this work.
Leigh Peake
Chief Education Officer
Thanks Traci! I can only imagine how great you must have been to have in class! There is so much overlap between the work we've been doing the past five years with middle schoolers and data and what we're doing together in Data Clubs -- it's been a real treat to have that all come together the last couple of years. Future direction: The two things we're thinking about and working on most intensely are 1) continuing to explore meaningfully connecting informal and formal learning experiences in the overall context of data-rich climate investigations; and 2) continuing to identify and build investigations of local ecosystems using robust local data sets alongside NASA's satellite data. Going forward, this will all be more deliberately set in the context of local connected learning ecosystems both in Maine (a network we've already been supporting the last few years) and around the Northeast with our museum partners as the hubs. Since both of our projects have explorations of ticks & lyme created by some of the same people, might be interesting to cross-pollinate!
Traci Higgins
Absolutely! My kids would have loved to be involved in investigations like the ones in your video. I kept thinking, we need this here in MA! We will most definitely keep talking.
Leigh Peake
Sue Allen
It's great to see LabVenture venturing into more complex inquiry skills. One question that always comes up for me is whether kids know the data is authentic, what they think that means, and whether it matters to them. In the museum world where genuine artifacts are so valued by curators, visitors often don't realize that the artifacts and sometimes their arrangements are "the real thing."
Sorry, I know it's an hour before shut-eye so no worries if you don't answer. Great project!
Leigh Peake
Chief Education Officer
Yeah, thanks for tossing an easy one over the wall at the last moment! I know that this notion of "authenticity" is a curiosity of yours, so I'm not entirely surprised by the question. To be clear, our working definition of authentic is that kids are working on problems that haven't been solved yet in ways that are developmentally appropriate but still as close as possible to how our scientists do that same work. That actually excludes some data that is essentially the replication of known science -- we know a lot about patterns that emerge when balls run down various ramps, even if kids are collecting the data themselves.
We haven't included questions about kids understanding of authenticity, or its incremental benefit, in the evaluation, but I'm inspired to do so. The mechanism we use to be sure they know it's authentic is primarily video -- we show the scientist doing "the same thing." We show the scientist's original data, which becomes their data. So, for example, Marissa MacMahan is our black sea bass scientist and you see her recording the data in her notebook. We then digitally flow kids' data into the larger data set that is identified as coming from Marissa. We also work extremely hard on the script that supports the on-site Educators who are guiding the experience, and that script reinforces authenticity.
Do the kids get it? Does it matter? I want to say yes but I don't have the evidence to confirm. I know from personal experience teaching that kids can sniff out anything that is clearly NOT authentic. They know when they are replicating an experiment for which the teacher/educator already knows the "right" answer. But I don't think we've yet proven the incremental value of kids pursuing messy data that isn't yet completely understood.
Betsy Stefany
Thank you for closing with this discussion of kids, authentic data and messy data. I look forward it continuing to scroll back to enable kids to be a part of building what data does for them and their interests over time. It's been extremely helpful to read the week of discussion at this site.
Raphael Isokpehi
Hi Randy, Thank you for providing the condensed set of priority data skills.