


- Lisa Dierker
- Professor
- A Data-Driven, Multidisciplinary Curriculum Providing Access to the Data Analytics Economy through Project-based Learning
- https://passiondrivenstatistics.com/
- Wesleyan University
- Kristin Flaming
- Faculty
- A Data-Driven, Multidisciplinary Curriculum Providing Access to the Data Analytics Economy through Project-based Learning
- https://passiondrivenstatistics.com/
- Valdosta State University
- Jennifer Rose
- Professor of the Practice
- A Data-Driven, Multidisciplinary Curriculum Providing Access to the Data Analytics Economy through Project-based Learning
- https://passiondrivenstatistics.com/
- Wesleyan University
Facilitators’
Choice
Choice

Public Discussion
Continue the discussion of this presentation on the Multiplex. Go to Multiplex
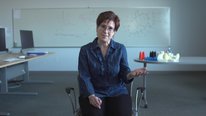
Lisa Dierker
Professor
Welcome! Passion-Driven Statistics is a project-based, introductory curriculum that has been implemented at liberal arts colleges, large state universities, regional colleges/universities, medical schools, community colleges, and high schools. Our goal is to create a welcoming (and empowering) experience that opens the analytics economy to everyone!
Kristin Flaming
M. Clark
Great opportunities for these students. It would be wonderful to integrate into math for Deaf education as so many of these students have a weak background in math foundations. Here it would be ok to ask questions
Kristin Flaming
Lisa Dierker
Lisa Dierker
Professor
We had been starting to work with the idea of translating our resources across different languages. I see that your Signing Bioscience Dictionary helps train interpreters for STEM classrooms. Very exciting! How do you choose what to add to the dictionary? Would you be open to including additional terms relevant to statistics education?
Kristin Flaming
Robert Reardon
Love the "come as you are" approach. So often students encounter "prerequisites" (either formal or implied). Wonderful to see the looks of surprise and interest on the faces of these students. And in the context of STATISTICS!
Kristin Flaming
Lisa Dierker
Kristin Flaming
Faculty
Robert those are some of the main reasons that attracted me to this model for teaching statistics. I have never seen such empowered students that understand statistics and want to engage with data and research beyond their required courses. I also love that each semester I have different students with a variety of topics so I as the instructor never get bored or feel like the semester just runs on repeat.
Kristel Gallagher
This is a life-changing program for students and educators alike! I truly believe in the value of teaching statistics through a passionate lense -- thank you for continuing to make it accessible for all <3.
Kristin Flaming
Lisa Dierker
Catherine Jones
Thank you for sharing. I will definitely pass information about Passion Driven Statistics to teachers in Alabama. Do you present sessions at state and national conferences?
Krista Woodward
Kristin Flaming
Lisa Dierker
Lisa Dierker
Professor
We do, and we are also always happy to plan presentations for schools or districts that are interested in learning more.
Krista Woodward
Kristin Flaming
Monica VanDieren
What a great program! I reach a Research Methods course for honors students across the majors preparing their thesis projects. I will definitely check out your materials since my course is about students conducting research on topics that they are passionate about. Some of my students have very developed statistical skills, but others have minimal to none, depending on the major. Therefore I think my students can learn from the materials that you have developed.
Also, I love the idea of having the students create poster presentations to showcase their work. Going to my university's undergraduate research conference and talking to students about the work they present in their posters is one of my favorite things to do each spring. It was encouraging to see in your video that K-12 students are getting this experience too.
Kristin Flaming
Lisa Dierker
Lisa Dierker
Professor
Please let us know if we can be helpful in any way. This is definitely a "for everyone" approach.
Kristin Flaming
Ambika Silva
I love the idea of students answering questions with data. Having students create posters is really exciting and gives students not only the chance to showcase their work but also gives them the opportunity to learn how to communicate what they're trying to portray both visually and orally.
Kristin Flaming
Lisa Dierker
Kristin Flaming
Faculty
Exactly Ambika! Most of my students come to the poster session anxious and having convinced themselves it is going to be a painful experience. As I walk around the poster session. I see students coming alive in a way I have never seen before as they engage in conversation about their research. It gives me chills every semester to see how much of an impact the course is for students future interest and thinking about statistics. I usually have a 6 to 10 students, mind you sophomore & juniors, take their posters to regional or state conferences to present their work.
Jennifer Rose
Professor of the Practice
I agree totally! At Wesleyan, we usually have over 100 students presenting posters each semester, and it is amazing to see how much they have learned and how excited and proud they are of their projects! It is truly rewarding.
Sara Yeo
Assistant Professor
I was so excited to see this video! I teach an undergraduate course on communication research and we learn to use the statistical program, SPSS, in the latter half of the semester. I'm wondering whether this approach might be scalable to social sciences and, if so, whether there is someone I might connect with to help me implement this in my own classroom! Thanks!
Kristin Flaming
Lisa Dierker
Lisa Dierker
Professor
Hi Sara, The model was developed originally for undergraduates in the social sciences and has been expanded across disciplines and to include younger students. I teach it as a full semester psychology statistic course at Wesleyan University. The best thing to start with is our e-book (which includes materials for SPSS as well as other platforms). http://bit.ly/Passion-DrivenStatistics
If you would like to see the way that I set up my course, you can sign up for a free Schoology.com account and use this access code V38D6-PZ44T. We would be happy to help you implement it in your classroom! I plan to hold on-line support sessions throughout the summer.
Sara Yeo
Kristin Flaming
Sara Yeo
Assistant Professor
Thanks, Lisa! I will definitely be using the wonderful resources you've put together for the fall semester!
Nancy Shapiro
Associate Vice Chancellor
This project strikes me as "the right thing at the right time." We struggle to make teaching and learning relevant to students, and this project is a great example of how to match student enthusiasm for asking questions, with tools for understanding how to go about answering them--by examine and analyzing data. I especially like the poster-session capstone, where students are the experts--how empowering!
thanks for sharing this project!
Kristin Flaming
Lisa Dierker
Kristin Flaming
Faculty
Nancy you are correct in that we focus on "just in time learning" and take a student-centered approach in the classroom. Our program has the basics that we feel all students should be exposed to and then we encourage our partners to add or remove content to best meet their students needs. I have found the poster session is the "ah-ha" moment that is critical to bringing the course full circle for the students.
Sarah Bichler
Thanks so much for sharing this video. I'm excited about the project and love how stats offers so many opportunities of making learning relevant and personal and applied. The resources you provide sound wonderful and I'll be definitely looking into them and sharing them with colleagues.
All the best,
Sarah
Kristin Flaming
Lisa Dierker
Lisa Dierker
Professor
Thank you so much for your help in getting the word out about the Passion-Driven Statistics model!
Kristin Flaming
Jack Broering
It was great to see that your program is reaching out to students to get them excited about using data. As an engineer at a large company I found that too few people were knowledgeable even about elementary statistics. In early 2000 our company invested in a training program (Six Sigma) which focused on using statistics to increase the efficiencies of our production plants, supply chains, office productivity, etc. What we found was that even very slight improvements in efficiency could result in huge savings for the company. It is my belief that by teaching these students statistics and data analysi early on will give them a great tool to add to their professional toolbox.
I really enjoyed your video. Keep up the great work!
Kristin Flaming
Lisa Dierker
Lisa Dierker
Professor
I completely agree. Given that data is now ubiquitous, its use and our reasoning about it needs to be a life long learning pursuit!
Kristin Flaming
Deborah Moore-Russo
Do you know if anyone has used parts of your eBook or corresponding videos for teaching quantitative literacy classes (those often offered to arts, humanities, and social science majors) at the postsecondary level? If so, I'd love to talk to them to consider ways I could work some of this into a summer course I am teaching that uses written projects (rather than exams) for assessments.
Megan Breit-Goodwin
Kristin Flaming
Lisa Dierker
Lisa Dierker
Professor
Hi Deborah, In addition to using the curriculum in courses the count toward statistic requirements at the college level, college courses with quantitative literacy designations have also been developed (e.g. Quantitative Reasoning with Statistics, Statistics for Decision Makers, Storytelling with Data, Research Methods, Introduction to Data Analysis, etc.). Suggested assignments in the e-book are all in written/project form and it is quite easy to forgo traditional exams given the focus on asking questions and sharing the story. We would be happy to help. Please do feel free to reach out ldierker@wesleyan.edu. I am also happy to put you in touch with others using the curriculum.
Kristin Flaming
Ivory Toldson
President
Very well done! Thank you for incorporating the critical aspect to empower students from underrepresented populations. I can also appreciate that your curriculum has been adapted to virtual leaning especially considering the current needs due to COVID-19. You have also addressed a common barrier which is cost by offering this curriculum for free. Keep up the great work!
I would be interested in learning more about how your curriculum has been adapted to address language barriers for student who's first language is not English or may not speak proficiently? How are the student's cultural backgrounds incorporated into their work?
Kristin Flaming
Lisa Dierker
Lisa Dierker
Professor
Thank you Ivory! Yes, a number of instructors are adapting the curriculum for on-line teaching. We have also created a data-driven, project-based MOOC allowing anyone with internet access to connect with a community with whom to learn these important skills.
https://www.coursera.org/learn/data-visualization
https://www.coursera.org/learn/data-analysis-tools
https://www.coursera.org/learn/regression-model...
The question of language barriers is such an important one. We have just started to work with a colleague in Peru who is translating the curriculum into Spanish. We hope to possibly follow this with other translations. The more clear way that we integrate student's cultural backgrounds is to have a rich collection of data sets available that let students pursue what is most important to them. I have had students whose parents immigrated to the U.S. for example, focus their work on questions about independence vs. interdependence within families, religious views surrounding reproductive health, or cultural barriers to treatment seeking, to name a few. One student who grew up without a father chose to explore the relationship between family structure and mental health outcomes. The most exciting thing about asking real questions with data is that each student can truly bring themselves!
Ivory Toldson
Kristin Flaming
Megan Breit-Goodwin
I can't wait to check this out for my own classes. I teach at an open door institution and reading can be a barrier to students. As I've transitioned away from traditional, formula driven teaching and learning - towards data centered experiences, I've noticed that students seem to better access the concepts and engage more fully. I haven't measured any of this and am wondering if your team is either directly assessing student access and engagement with the material - or know of good tools that could be used.
Kristin Flaming
Lisa Dierker
Kristin Flaming
Faculty
Megan please reach out when you start planning adopting the model. I am happy to give suggestions and explain the variety of approaches our partners use with the model. kristin.flaming@gmail.com
Kathryn Kozak
This is a great program. I am a developer of StatPREP, where we are trying to teach faculty how to bring data centric statistics into the classroom. I can see these two programs would work nicely together. Statistics is about asking questions and collecting the data to answer the question. I would like to see your material and see if it is adaptable for a community college curriculum. We need to meet our articulation agreements, so we need to make sure we are covering our curriculum. Do you know of any community colleges that use this material. Where can I find the material?
Kristin Flaming
Lisa Dierker
Lisa Dierker
Professor
The e-book laying out the project-based approach supporting several software platforms can be downloaded here. http://bit.ly/Passion-DrivenStatistics
There are publications and additional information on the website https://passiondrivenstatistics.com/
Another useful resources is our translation code www.bit.ly/PDSTranslationCode
Some instructors teach as usual and include a data project in the last few weeks of the semester. Others transform the entire semester with the project-based approach. The model has been implemented as a statistics course, a research methods course, a data science course, a capstone experience, and a summer research boot camp with students from a wide variety of academic settings including a few community colleges. Other settings have included liberal arts colleges, large state universities, regional colleges/universities, medical schools,and high schools.
Folks who are using the model are also sharing supporting resources that they create. We have those available on Schoology.com. Feel free to reach to me for the access code. ldierker@wesleyan.edu
It is completely flexible. We provide a data project approach to a statistics curriculum, but any content can be added based on the needs of different programs. Basically, if you have students start with exciting data sets and their own questions, and everything you teach them is in the service of answering those questions, you are doing it! Some of our resources may be helpful, but the model is simply one of authentic research with introductory students (in any discipline).
Brett Jones
Sounds like a great program! I wish I taught statistics so I could try it out!
Kristin Flaming
Lisa Dierker
Kristin Flaming
Faculty
The condensed model can be adapted into any course that would like a data driven project. We can help identify a data set that makes sense for the course. In our resources we have a version of the model that is completed in either a week boot camp version or 12 to 16 hours of class time devoted to it. We have partners that spread it throughout the semester and others that use the last few weeks of class. Feel free to reach out via email if you would like to learn more. kristin.flaming@gmail.com
Barbara Reisner
Thanks for your video! Having students ask their own questions is so powerful. I plan to share this with a bunch of educators that I know. I love the flexibility built in so that students can choose their own problems.
Kristin Flaming
Lisa Dierker
Traci Higgins
What a great program! Statistics makes so much more sense in the context of something one cares about! Clearly the question is a driving force. This makes me really curious about the questions students come in with, especially at the high school level, and the work around turning "wonderings" into questions that can be investigated with data. I am also curious about students' work around defining and figuring out how to measure the variables they are interested in. Often the posing of questions and the work around quantifying variables is not part of traditional statistics courses, but in the context of this course, those aspects of data science seem to be extremely important. What are some things you have learned about supporting students in question posing and thinking through measurement issues?
Kristin Flaming
Lisa Dierker
Kristin Flaming
Faculty
We use large archival data sets in our full model and high school version. Students spend the first couple of weeks deciding on one of the data sets we provide and then choose topics and variables from the code book to work with the entire semester. An example is Wave 4 of the National Longitudinal Study of Adolescent to Adult Health.
Jennifer Ward
I love this! I like that the target of your work is historically non-dominant groups and creating ways for them to aim high and succeed in statistics -- and life -- by studying what interests them most. I think I'll show your videos to my statistics students. :D
Lisa Dierker
Kristin Flaming
Christine Sachs
I appreciate the video and resources. What a great program for involving students in data and statistics and providing them with opportunities for future success.
Kristin Flaming
Lisa Dierker
Saira Mortier
This is exactly what STEM education needs. Emergent curricula that is student focused. Do you have info on how many programs have used your resources? Or if the approach has been adapted?
Kristin Flaming
Lisa Dierker
Lisa Dierker
Professor
Those involved with data collection for our current NSF grant can be seen on this map https://passiondrivenstatistics.com/partner-institutions/. Many more have used the resources from the program. It has been adapted for statistics courses, research methods courses, data sciences courses, capstone experiences and summer workshops. It is currently being used by liberal arts colleges, large state universities, regional colleges/universities and community colleges. A few high schools are also using it in their statistics curriculum. Here is a published article with data from different academic environments. https://scipg.com/index.php/101/article/view/26/24
Zoran Popovic
Juliette Lantz
This is such an exciting way to bring data and statistics and passion to students who might never put those three words together. I can see this approach becoming a foundational course in liberal arts general education requirements. Thank you!
Kristin Flaming
Lisa Dierker
Lisa Dierker
Professor
Megan: Great question. One of the challenges for us has been to identify meaningful groups to compare the experiences of students in this project-based model. When we have compared passion-driven statistics students to those enrolled in a traditional math statistics course, we found that passion-driven students reported more positive course experiences (e.g. reported preparing for class more frequently, were more likely to rate the course as more useful than other courses, and more rewarding), showed a greater likelihood of increases in confidence in managing data, choosing the correct statistical test, and writing syntax or code to run statistical analyses. They also showed greater interest in pursuing additional course-work in statistics and related topics.
We have not yet explored a more nuanced approach to understanding engagement with the materials and I am not familiar with standard measures to do this (though there may be many). Part of that has to do with the many different ways that instructors have used the model. Although our materials are meant to be helpful, the model can be supported without them. The idea behind the model is no more than providing "just-in-time" and "need to know" information in support of students own questions. We would definitely like to work on better understanding the role that one-on-one support plays in creating an empowering experience for students.
Bryce Hughes
As someone who uses statistics a lot in research, I enjoy finding new ways to convey what I enjoy about quantitative methods to students, especially students who swear they are "bad at math" or "not a math person". I teach in a graduate education program where we are teaching research methods to a population that is generally not preparing for a career in research, but where knowing research methods will help them in their careers, especially as they advance into leadership roles. To what extent do you think this approach translates to the graduate level? I could see it being a good fit with our first statistics course in the sequence, but I can see this approach as useful in adding some kind of "flavor" or "spin" on how we teach quantitative methods at the doctoral level as well. Would love to hear your thoughts! Thank you.
Lisa Dierker
Professor
Yes. I have taught it at the grad level here at Wesleyan and others have as well. The largest course at the grad level that uses the model is taught by Erik Erhardt at the University of New Mexico. We have also taken it as a research boot camp to a medical school and Janet Rosenbaum at SUNY Downstate Medical Center teaches it as a research methods course and as a categorical statistics class to epidemiology graduate students. It has been particularly easy to use with grad students given that you have so much more buy in so much earlier in the semester. Let us know if we can help!
Bryce Hughes
Thanks! That's really helpful to know. I passed the video link along to my colleagues who also teach our department methods courses, and we may be in touch. I think it'll be a while before I'm back in rotation for quantitative methods, but I'll refer my colleagues if they want to learn more as they plan for our next course offerings.
Nicole Freidenfelds
This is fantastic!
We have some trouble attracting high schoolers from underrepresented communities to join our free environmental-based program. How do you find and recruit the students who participate?
Kristin Flaming
Lisa Dierker
Professor
For the high school boot camps, we partnered with the GEAR UP program sponsored by the Department of Education. There are GEAR UP programs in every state that support cohorts of high school students from middle school through high school. My sense is they are always looking for high quality programs to get their students involved in.
Nicole Freidenfelds
Thanks, Lisa!
Jill Rhoden
This is an exciting program! We work with high school students (High School Research Initiative video) who are asking questions and designing physical experiments but have had more and more students over the years who are interested in using data sets to ask and answer questions. Our curriculum covers basic descriptive and inferential stats but I am excited to review your materials as we prepare for a new version our our course that will include expanded stats options. Thank you for sharing!
Kristin Flaming
Lisa Dierker
Lisa Dierker
Professor
HRI looks like a wonderful program and exactly what students need at both the high school and college level. The earlier they are exposed, the more they can accomplish. I look forward to when this is the norm for all students!
Krista Woodward
This is a program that could do so much for all of our learners and teachers! Coming from a k-12 perspective, I think you get at the heart of the importance of statistical analysis for teaching and learning. In our school district, we've found that statistical analysis at all grade levels often takes a back burner to other math concepts. A group of us math and science TOSAs (Teachers on Special Assignment) have been working to inform each others' departments on which math practices and concepts are most important for use in the k-12 science courses. Statistical analysis is at the top. I love that the concept of this project goes beyond science class. How wonderful would it be to have all students - all learners- see the value of statistical analysis through their own lenses/experiences! I'm sharing. Thank you!
Kristin Flaming
Lisa Dierker
Kristin Flaming
Faculty
Thank you Krista for the feedback. We would be happy to share our resources for the high school model that could be adapted to younger age group. Do reach out if we can be of help with integrating statistics into your teaching and learning. If a district or group of teachers are interested in adopting the model we do offer onsite workshops. kristin.flaming@gmail.com
Dennis Pearl
Hi Lisa,
It's great to see that your wonderful program has expanded beyond the intro college level and is being adopted and adapted at so many institutions.
Kristin Flaming
Lisa Dierker
Lisa Dierker
Professor
Thanks Dennis, We have appreciated your support through the years and that of the stat ed community. Lisa
Kristin Flaming
Hollylynne Lee
I agree with Dennis! Loved seeing how this passion-driven approach was used to support younger students in this GEAR-UP project! It was fun to see them in action in the video!
Kristin Flaming
Lisa Dierker
Professor
Thanks Hollylynne. We definitely hope to do more with high school students!
Kristin Flaming
Mari Strand Cary
I collaborate with the local STEM Hub (PreK-12, community college, 4-yr college, community) and county "educational service district" and this seems a perfect fit for their missions and reach. I'm REALLY interested in how the extent to which this program has been used in with high school students and also community college students. How much focus has your team put on researching effects in these two contexts? Are there opportunities for collaboration?
Kristin Flaming
Lisa Dierker
Lisa Dierker
Professor
We have some partners at the high school and community college level. Feel free to reach out for contacts. Some of the experiences are documented in the following journal articles:
http://redfame.com/journal/index.php/jets/article/view/2187
https://scipg.com/index.php/101/article/view/26/24
https://doi.org/10.1111/test.12209
Kristin Flaming
Emily Weiss
This project sounds wonderful! I know data skills are something students really struggle with across the board, and we've worked hard to help teachers develop the skills they need to support students in this area. I love the idea of having kids engage with data completely of their choosing, driven by their passions. Do you know of anyone who has used your materials with informal education programs, e.g., Citizen Science programs or research camps, etc.?
Thanks!
Emily
Lisa Dierker
Lisa Dierker
Professor
We have adapted the college level course to work as a summer research boot camp for students as early as 9th grade. We partnered two summers with the GEAR UP program on this. The great thing about the model is that you start telling stories about the data from the very beginning so there is no necessary end point. As long as students are driving the questions, it seems to be engaging across the board. Happy to share our materials. For informal programs we have simplified the steps into a model handout rather than using the videos.
Kristin Flaming
Frieda Reichsman
What a cool project! Thank you for bringing students to data they are passionate about - it makes all the difference.
Kristin Flaming
Rebecca Ellis
The ability to meaningfully apply statistics to an idea the student cares about is so important! In the lay world, people often think of statistics as being something dry or manipulative, and so changing this stigma and bringing its true benefits to students is amazing. I wish everyone would take your course!
Kristin Flaming